SimSinistre: a platform for civil protection exercises
The SimSinistre platform, with its innovative geographical approach, will enable m …
Ms Anik Daigle, Cégep Garneau and project principal investigator
Gespe’gewa’gi Institute of Natural Understanding (GINU)
Direction principale de l’expertise sur la faune aquatique (MELCCFP)
Natural Sciences and Engineering Research Council of Canada (NSERC) Applied Research and Development (ARD) Program
Water temperature in rivers and lakes is a determining variable in water quality and aquatic habitats, affecting dissolved oxygen, the toxicity of certain pollutants, the proliferation of invasive species and the metabolism of aquatic organisms, among other things.
Although the importance of monitoring the temperature of our rivers and lakes is now recognized, existing monitoring networks in Canada remain limited in time (recent) and space. As a result, our knowledge of thermal regimes is still largely fragmentary, with important consequences for our ability to characterize water quality and aquatic habitats, assess the duration of ice and ice-free seasons, their effects on spring freshet, on the phenology of aquatic species, on fishing, and so on. Without in-depth knowledge of these different processes, it is also difficult to anticipate the effect of global warming on each of them.
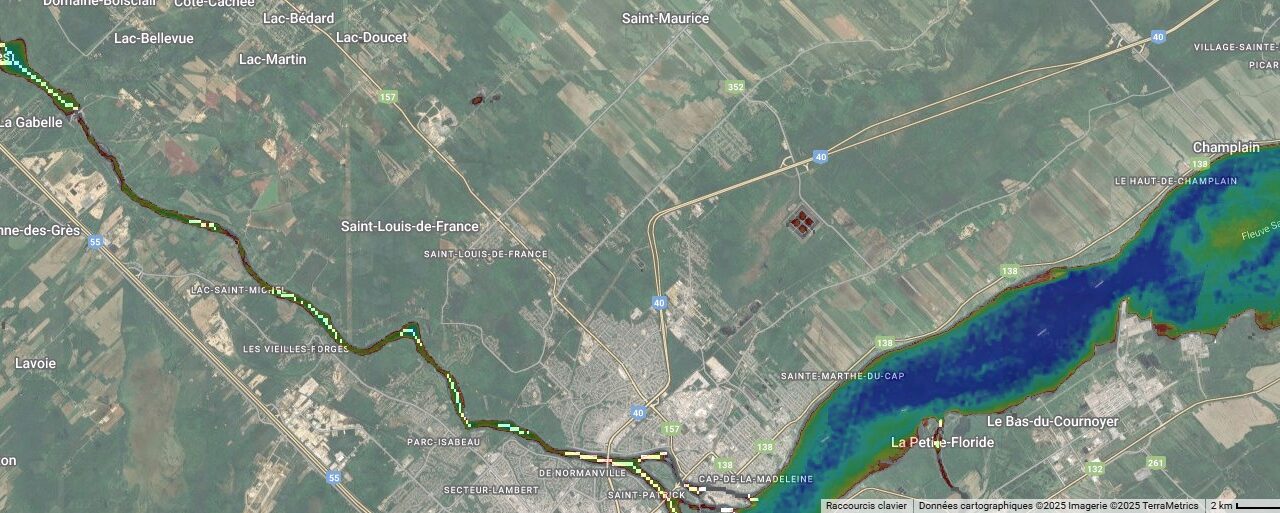
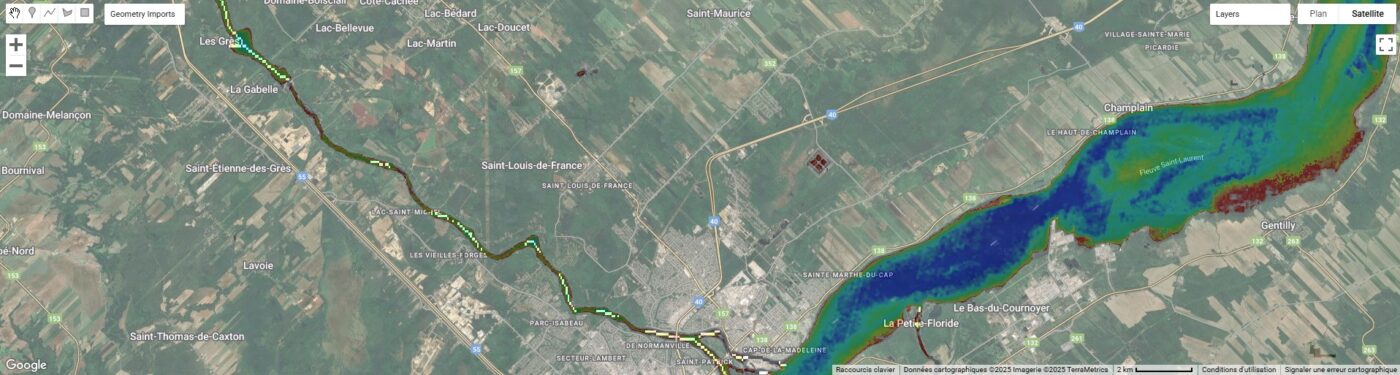
We propose here to substantially enrich the thermal portrait of Eastern Canada’s hydrographic network using satellite remote sensing.
This project aims firstly to automate the identification of “water” pixels in Landsat images, and then to use the information extracted from these pixels to
Thermal infrared imagery measures the temperature of a surface by exploiting the link between temperature, spectral radiance and emissivity of the surface in question. This imagery is available on Google Earth Engine (GEE), but to meet the requirements of the project, thermal information should only be extracted from pixels that are 100% within a watercourse (so-called “sentinels”), so as to avoid false measurements and inducing noise in the thermal profiles.
Identifying “sentinel” pixels in Landsat thermal images
To do this, different sources of information are cross-referenced to assign a probability of “water” membership to each pixel likely to represent a stretch of water.
Longitudinal interpolation
Sentinel pixels, identified as “pure”, enable temperature measurements at several points on lakes and rivers. These measurements are typically spatially disjointed, as they are separated by river sections where pure pixels could not be identified. Interpolation is carried out along the river’s longitudinal axis using conventional methods (one-dimensional linear or cubic interpolations), or using regressions based on local characteristics likely to influence temperature (e.g. elevation, order, river km, width, orientation, slope).
Field validation
Some historical data acquired in medium to large rivers and included in the RivTemp (rivtemp.ca) and DataStream Atlantic (atlanticdatastream.ca) databases are used to validate the temperature values obtained by the sentinel pixels identified, and to assess their accuracy and potential bias.
Spatio-temporal characterization of thermal regimes
Various types of information are extracted, and some measured, from the thermal profiles derived from Landsat images, such as :
Setting up the distribution interface
GEE offers efficient online deployment options through an integrated solution called Apps Engine, which supports real-time interaction with data, enabling users to explore and analyze geospatial information dynamically, and access interactive map, graph and dashboard displays to present analysis results intuitively.
Resource management
Environmental monitoring
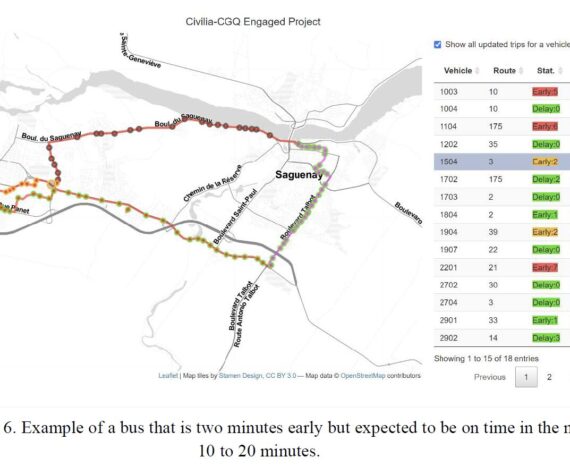
The SimSinistre platform, with its innovative geographical approach, will enable m …
The project aimed to help Blaise Transit improve and automate its platform using a …
A real-time tracking, planning and decision-support platform for use in infrastruc …